i just came across an interesting article about the effects of tire pressure on contact patch and other characteristics like deflection. half way through the article i was becoming convinced the data were just wrong or the engineer had mislabelled the data columns because for example lowering the tire pressure under certain loads actually decreased the tire deflection. (i.e. the front tire radius for 550lb load is 308.3mm @ 28PSI vs 310mm @ 18PSI.)
is it possible this effect is similar to the traction circle concept, where if the rubber is using more elastic energy to counteract the increased air pressure, there is less left to counteract the load of the car?
does anyone know how accurately this complexity is modelled in lfs?
well that's depend actually because many factors influence on tyre radius. rotationnal speed, camber, wear (it change the structural properties of the tyres), temperature,...
Tyres are so complex, lfs should probably focus on some more useful stuff tbh like having aero map pitch sensitive, and what about having aero load actually creating some spring deflection and requiring the use of bump stop?.
i want to agree that there are other priorities...
however, in a quote from the article "If we look in the middle range at a load of 553 lb, the calculated contact patch area is 67.42mm. At the same time, the front tire at almost the same load has a contact patch area of 67.35mm. This is almost no change at all, and in fact within a reasonable error limit it is probably sufficiently accurate to say that the wider tire has the same contact patch area as the narrower one does at around 500 lb load.
At very low and very high loads the wider tire does have a larger contact patch size, however"
this kind of behaviour should have a big impact on fine tuning the handling around the limit.
but i still want to agree that LFS needs to put a priority on what will affect our online races.
Well to be honest, having everything which is higher that contact path is more important to have first before having a perfect tyre model. If you start with the tyre model, you will be misleaded by errors in suspension kinematics, aero load,...so your tyre can't be realistic...unfortunately that's how lfs have been developed, even if lfs physics are better than most of video games, there is still many way to improve it before investigating in depth tyre model.
A suspension linkage has a well-defined movement path with equally well-defined spring rates, damping rates, camber curves, and toe curves. It largely boils down to simple geometry. Suspension is much easier to model than a tyre. Orders of magnitude easier.
yeah that's why it's better to do it right before going into the complex things...And if you want to take into account all the possible setting your suspension kinematic can have, that's actually not only a toe curve but you have to implement a multibody model with possibility of setups (toe,caster,pSteer,camber,ride height,...).
you have a point momo. if adding better tyre load response costs more CPU than adding better aero response, then aero would come first since both have a big effect.
i think we can agree that a properly simulated multibody suspension is pretty far away. does LFS even have a dynamic roll center? it seem obvious it must but the previous S1 had no dynamic camber or tyre heat modelling!
if there is a concept like the traction circle at work that makes the impact of tyre pressure on the contact patch more complex than just "patch_size = weight / tire_pressure", then having this added to the tire model would be like the difference between the grip model respecting the traction circle vs allowing max lat and long grip at once.
i remember reading that thread Daniel. unfortunately, i don't think LFS could implement that. also although there is a difference it is so small the driver doesn't notice it?
one of the strong points of LFS is the client-side prediction model and i don't believe that model could work with some variables affecting the tire radius. currently you can use tweak to change your tire parameters but all racers on the same server have to have the same parameters, right?
Carl, the data on that page was copied correctly from the tire data supplied by Avon, so if there's a mistake in it, it's Avon's. If you read the full article you should see that I was just as surprised by the results as you are.
I wrote the article probably seven or eight years ago. Since then I've realized there are much easier ways to check the contact area formula and show how wrong it is. It may help you to know that this is the only time since then that I've seen data showing a result like this where reducing pressure caused the resting radius to go in the opposite direction you'd expect. Normally it's just what you would think: Reducing pressure sinks the tire down rather than the opposite. So we can't rule out the possibility that the data from Avon was incorrect.
Not sure I understand the question. Perhaps you might be overthinking it?
When it comes to vertical motion and tire contact load, you can think of a tire as being a simple spring extending from the center of the tire to the ground. The spring rate changes with air pressure a great deal, and to a lesser extent it changes with camber and load. Generally in vehicle models the assumption is made that the spring rate is constant at each camber and pressure and doesn't change with load. If you plot out tire deflection versus load it's usually a pretty straight line once you get up into loads the tire normally sees. At very light loads it can deviate from this a bit, but it's not of much consequence to the car so you're generally safe ignoring that.
In that sense LFS is probably just fine. I don't know if the spring rate changes with load or pressure in LFS. You could test this by going between full and minimum pressure and see if it changes the ride height of the car and the vertical deflection of the tire. I would bet that it does it just fine in LFS, but am not 100% sure. Maybe the link Daniel-Cro posted might show it?
Whether or not LFS follows the simple formula discussed in my article, I don't really know. If it's using a set spring rate for each pressure and camber or whatever, then it might not. It might be of no consequence either way unless the in-plane tire forces are computed from the contact length. Your guess is as good as mine there though, I don't really know.
LFS has very clear and pronounced lateral tyre deflection with low tyre pressures. When it was first introduced, I recall a lot of people said it was exaggerated. I seem to recall Scawen saying vertical deflection is not modeled. If you play with LFSTweak a bit you can get what appears to be vertical deflection. I'm pretty sure the pressure does affect ride height, so maybe that statement is outdated.
perhaps, i'm really not sure if what i was thinking makes sense.
if we take the Avon data as correct - and i don't see why we shouldn't - then there is a logical explanation for the tire deflection being greater even with more air pressure. of course this only happened in a specific case, but if true it highlights a complexity in how grip relates to tire pressure and load that would be missed in a linear model.
my thinking is that there is some maximum force that is shared among more than one work. in a similar way to the traction circle concept where the maximum grip has to be shared between longitudinal and lateral forces, the elastic force of the rubber in the tire could be shared between resistance to air pressure and resistance to deformation due to load.
we know that a tire carcass in and of itself has some ability to support a load. even without air in the tire, the rubber resists deformation. when it is deformed, it stretches. we can say that the more resistant the rubber is to stretching, the more load it can hold. this makes sense because a harder compound could hold more weight for a given deflection.
when we add air pressure we get a complex relationship. on one hand the air inside the tire presses out against the rubber and acts to hold up the load. as the air resists compression, so it resists the load deflecting the tire. however it also expands the rubber of the tire and as it does this it makes the rubber stretch.
since increasing air pressure uses some of the rubber's elastic resistance to stretching, there is less of that resistance available to support the load.
--
having said all that, it's only a conjecture so i invite people to tell me i'm wrong or what the actual cause is, or that the data is wrong. i also think momo has a valid point that we have to wonder if creating a "non-linear contact patch vs air pressure and load model" gives enough bang for the buck compared to other things that could be advanced in the lfs physics.
for one thing the complex behaviour only happened in a specific case. i think the narrower a tire is, the more the sidewall works to support the load which might explain why that case showed the behaviour.
we have to ask ourselves "did Avon specifically choose tire dimensions that would make use of this complexity to affect handling during transitions in cornering direction and during turn-in?" if the front tire contact patch is actually larger than the rear under light loads, this could affect e.g. how the car balance changes as the inside tires under cornering see increased load during a transition from turning left to turning right.
many people have a complaint that lfs setups are unrealistic. better modelling of tire contact patches vs load could lead to more realistic spring and damper tuning. i say could. i'm no expert!
i'm pretty sure the current lfs model uses a linear approach. this makes sense because S2 had to get off the ground and every little complexity can take a looong time to code, debug and properly test. we know for instance that in lfs the spring rates are constant with respect to spring deflection. there are a lot of little simplifications like that which were used to save time and computational requirements and i think Scawen did a great job of prioritising which things to do in a complex way. we definitely get more challenge and enjoyment out of having many independent points of heat storage in each tire than we would from having a more complex spring rate vs spring deflection model.
Interesting idea. I don't know for sure, but wouldn't think that's the case. This is a bit like saying that if you blew up a balloon there might be a point where the tension in the balloon decreases.
The strength in the tire isn't so much the rubber, it's the cords. When the internal pressure is increased, those cords go more into tension which increases the stiffness, hence the increased spring rate you get. My thinking of the strange Avon case was that maybe the shape of the tire changes in such a way at some point as it's being inflated that it becomes softer in the vertical direction. I don't know, but when I was trying to think of a reason at some untuitive level why this might occur, that's what went through my mind. It could be nonsense though. To really know you'd have to do an FEM analysis on it or test it again to really make sure.
I personally suspect there may just be an error there because it's the only tire I've ever seen data like this on where it appeared to happen. Paul Haney's book "The Racing and High Performance Tire" shows what looks like a rougue data point in one tire that he thought might have just been bad data too. I've seen some questionable data before on other things showing backwards load sensitivity from Michelin and that kind of thing, so it's not out of the question.
I did think later of rewriting that article to make the same point with a tire whose test results are more typical, but I was just writing the article for my own amusement and didn't really care to bother with it by the time I was done. In the end there were two tires there, one that was goofy and one that wasn't, so I just left it to show that things are not always as expected. I honestly never expected anyone to see the article anyway as there's no link for it on my site, but Google being what it is, I get 400-800 hits on it every month anyway.
When it comes to sims, a linear vertical model works well enough usually as long as you allow the spring rate to change with pressure. That covers the general effects described in the article well enough usually except for the part where the tire started sinking at still higher pressures. So that'd be the only part that's probably much different from LFS, and it's a fluke or mistake anyway so I wouldn't be worried if LFS didnt' do that. If you want to go further with it you can make it change with slip angle/lateral force and/or camber, that'd be more interesting than having a freak tire that does what the Avon tire appeared to do.
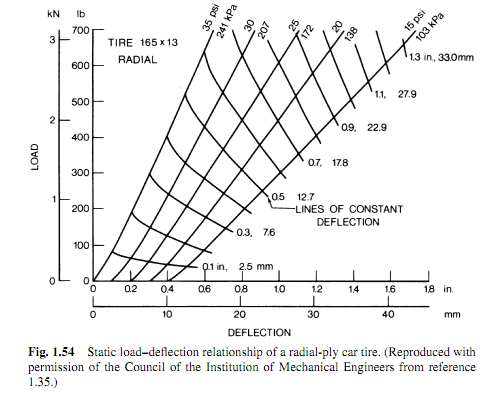
Here's an example of a set of load versus vertical deflection curves:
The lines moving up and to the right are pretty close to being a constant slope, with the slope being different at different pressures. Usually near zero load you'll see a little change in slope, but when you're just interested in the characteristics at the loads the tire normally sees when it's on a vehicle, that part is not really touched anyway so it's not real important.
Sometimes you'll see graphs like this that show load versus contact length instead of vertical deflection. These are more akin to load versus gross contact area, so if I were to rewrite that article today I would just use those data. To show that the contact area = load / pressure formula was wrong you could just show it in the slopes of the lines. I.e., doubling the load doesn't increase contact length (and therefore the approximate contact area) by 100%, it's usually closer to 50%. That in itself would have made the point and done it with a lot less rambling. :rolleyes:
The important thing to note from the load/deflection curves is you never see what the Avon tire showed. For that to happen the lines moving up and to the right would have to curve sharply back to the left at higher loads. I've never seen it any data of this kind or anywhere else. So it was just dumb luck that I happened to pick a pair of tires for that article where one of the tires either really did that, or just had bad data. I'm inclined to think the latter was the case.
maybe it's more accurate to say the resistance per square inch on the surface of the balloon decreases. of course this goes against what we commonly know from experience, BUT we don't have access to an infinite variety of balloons with varying rubber thicknesses and compounds.
except that a racing application sees extremes of load sometimes with tires off the ground...
i'm attaching a plot of front vs rear contact patch area per pound of load based on the data in your article. the curves seem reasonable and don't give the impression of totally wrong data.
it's also worth noting that the crossover characteristic of the front and rear contact patch areas is probably designed by the engineers to influence the handling. seeing as it is a formula car and all...
i didn't incorporate the patch pressure data though! does anyone know if available grip is directly proportional to patch area x patch pressure?
Two tires crossing over each other like you see in the plot isn't the problem. That just means they have different spring rates which is to be expected seeing as they're two different tires. It's virtually impossible to make two different sized tires have exactly the same spring rate.
It's interesting to see but it doesn't say anything about the goofy data set. That is only visible when you plot the same tire at several pressures and find the slope reverses direction at the one pressure.
I would still suggest that if that data is correct, the anomaly might be due to the tire changing shape suddenly at some pressure rather than the cords becoming less stiff at the higher pressure for no good reason. Think of it like a spring inclined in a suspension system. A stiffer spring inclined at a larger angle could give a smaller effective rate in the vertical direction just because it's inclined. I.e., an infinite rate at 90 degrees to the axis you're interested in means a rate of 0 lb/inch in that direction. Similarly, a change in carcass shape might produce the same result through the cord angles and so forth being different in the ground's reference frame. To me this seems like the most likely case aside from the data being a bit dodgy to begin with.
There's plenty we don't know about the details of the test too. Maybe the temperature changed a lot, or maybe they tested the first few pressures, then switched tires, then switched back to the original tire and tested at the final pressure. There are a lot of possibilities here for this kind of thing. I've seen weird things like that before in lateral force vs. slip angle tests where the results would mislead you into thinking a tire had reversed load-mu sensitivity. It happens more than you'd think.
doh! you're right that plot doesn't cover the strangeness in the data mentioned in your article. i'd have to make another plot since i'm a visual type of person and would like to see if it's at least a smooth curve.
Pretty sure LFS generates tyre spring stiffness values (vertical and other directions) from some constant tyre stats, and the dynamic pressure. So it's continuously varying as your tyres heats and cools (as this changes the pressure).
I don't recall camber influencing the result (in LFS) but it's been years since I looked into this.